Summary
In April 2017, a production JBoss Seam node began experiencing intermittent hangs, slow response times, and severe CPU saturation. The customer initially suspected that the application could not handle five newly added outside workers.
Early JVM diagnostics showed repeated full GC cycles that failed to reclaim memory, suggesting long-lived session beans or extended Seam conversation contexts. Further investigation revealed the system had been compromised using the JBoss Seam Expression Language injection vulnerability (CVE-2010-1871). A crypto-mining workload executed during peak hours, consuming CPU and preventing the JVM from completing garbage collection.
Timeline of Events
April 17
Intermittent slowdown observed on App4. CPU spikes noted but quickly return to normal. Customer suspects capacity issues due to five newly added workers.
April 17
JVM heap and GC logs collected. No clear memory leak signature. GC activity appears healthy.
**April 18 **
Under moderate load, old generation memory rises near its 4 GB ceiling. GC continues reclaiming space. Users report UI lag.
April 19
Slowdowns increase. Thread dumps show long GC pause windows without abnormal object retention patterns.
April 19
App4 becomes intermittently unresponsive for several seconds. Internal support priority raised.
April 20 – Heavy Load
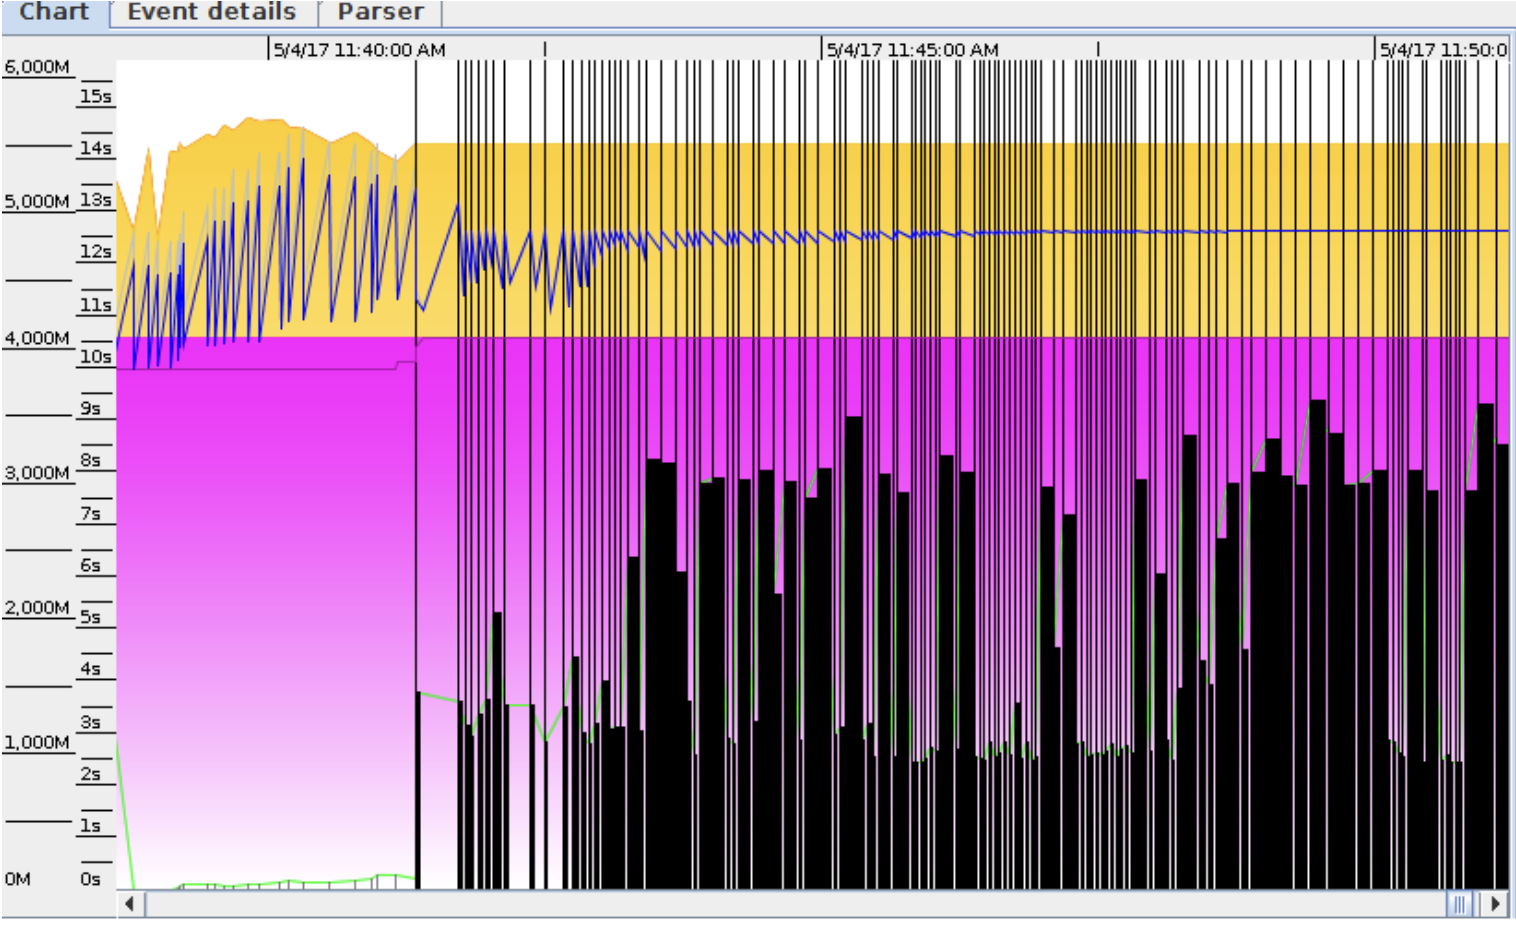
GC logs show repeated full GC cycles reclaiming little memory. Pattern resembles session bean retention but does not match expected data volume.
April 20
Node enters continuous GC thrashing. Restart provides only temporary relief.
April 21
Client approves bare-metal access for deeper investigation.
April 21
Host-level metrics reveal unexplained CPU saturation during peak hours, even with low application traffic.
April 21
Suspicious binaries discovered in /tmp, along with shell scripts using wget to retrieve payloads.
April 21
Crypto-mining workload confirmed as the source of CPU starvation.
**April 22 **
Node isolated, malicious artifacts removed, and vulnerable Seam endpoints patched.
Symptoms Observed
- Intermittent UI lockups and multi-second hangs
- Full GC thrashing with minimal memory reclamation
- High CPU usage despite low incoming traffic
- No consistent memory leak signature
- Behavior not consistent with typical Seam conversation leaks
Heap Snapshot Analysis
A heap histogram showed millions of Hibernate-related objects, a pattern commonly associated with large persistence contexts:
1
2
3
4
5
6
7
8
9
10
11
12
13
14
15
16
17
18
19
num     #instances     #bytes       class name
---------------------------------------------------------------
1:      12090201      587650288     [Ljava.lang.Object;
2:       2638088      408940024     [C
3:       8025449      385221552     java.util.HashMap
4:       6515019      312720912     org.hibernate.engine.EntityKey
5:       8073734      285294688     [Ljava.util.HashMap$Entry;
6:       3818123      244359872     [redacted].ejb.domain.Assignment
7:       6951666      222453312     java.sql.Timestamp
8:       5066393      202655720     java.util.LinkedHashMap$Entry
9:       3102751      173754056     org.hibernate.engine.EntityEntry
10:      4730509      151376288     java.util.HashMap$Entry
11:      2115091      135365824     org.hibernate.proxy.pojo.javassist.JavassistLazyInitializer
12:       734896      135220864     [redacted].ejb.domain.Stay_$$_javassist_43
13:      5423455      130162920     java.util.ArrayList
14:      7244162      115906592     java.util.HashSet
15:      2956367       94603744     java.lang.String
16:      5701986       91231776     java.lang.Integer
17:       682023       76386576     [redacted].ejb.domain.Patient_$$_javassist_102
Although these patterns often indicate persistence context issues, the heap was not leaking. The JVM appeared stalled because it lacked sufficient CPU to complete full GC cycles.
Investigation and Analysis
The investigation initially focused on long-lived stateful session beans, oversized Hibernate entities, and extended Seam conversations. GC logs confirmed full GC thrashing but did not indicate classical memory leaks.
Thread dumps and traffic metrics showed low request volume, inconsistent with application-layer retention. After bare-metal access was granted, host-level monitoring revealed unauthorized workloads.
Binaries in /tmp and scripts using wget confirmed that crypto-mining payloads were being downloaded and executed. The intrusion path aligned with CVE-2010-1871. The exploit was reproduced in a controlled test environment using Metasploit, validating the remote code execution vector.
Crypto-mining activity saturated CPU resources, preventing the JVM from completing garbage collection. The heap itself was healthy, but the JVM could not make progress.
Root Cause
Remote code execution via the JBoss Seam EL injection vulnerability (CVE-2010-1871) allowed deployment of crypto-mining binaries. Mining workloads consumed CPU during business hours, preventing garbage collection and causing system-wide unresponsiveness.
Resolution Steps
- Isolated the affected node from the network
- Removed malicious binaries and scripts
- Patched and hardened Seam endpoints
- Implemented host-level CPU and process monitoring
- Enabled outbound traffic alerts
- Established patch management for legacy frameworks
Prevention and Recommendations
- Deprecate and replace legacy JBoss Seam components
- Perform regular scanning for EL injection vulnerabilities
- Monitor CPU usage at both JVM and host levels
- Restrict execution permissions on temporary directories
- Implement anomaly detection for unexpected processes
Technical Appendix
CVE Reference
CVE-2010-1871 – JBoss Seam EL Injection (Remote Code Execution)
Reproduction Environment
JBoss Seam 2.x, matching the customer configuration, tested on an isolated VM.
Evidence Collected
- GC logs
- Thread dumps
- Process lists
- Cron schedules
- Crypto-mining binary hashes
Indicators of Compromise
- Unauthorized
wgetscripts - Unexpected binaries in
/tmp - CPU saturation during low traffic
- Unauthorized outbound connections
Screenshots and Artifacts
Artifacts retained in the internal incident archive.