
In this installment, we describe a bit of my work with multiband signals for seaweed classification. They could be hyperspectral or multiband. I typically work with 10-band signals, where band 10 is near-infrared (NIR) and band 1 is blue band (~450 nm).
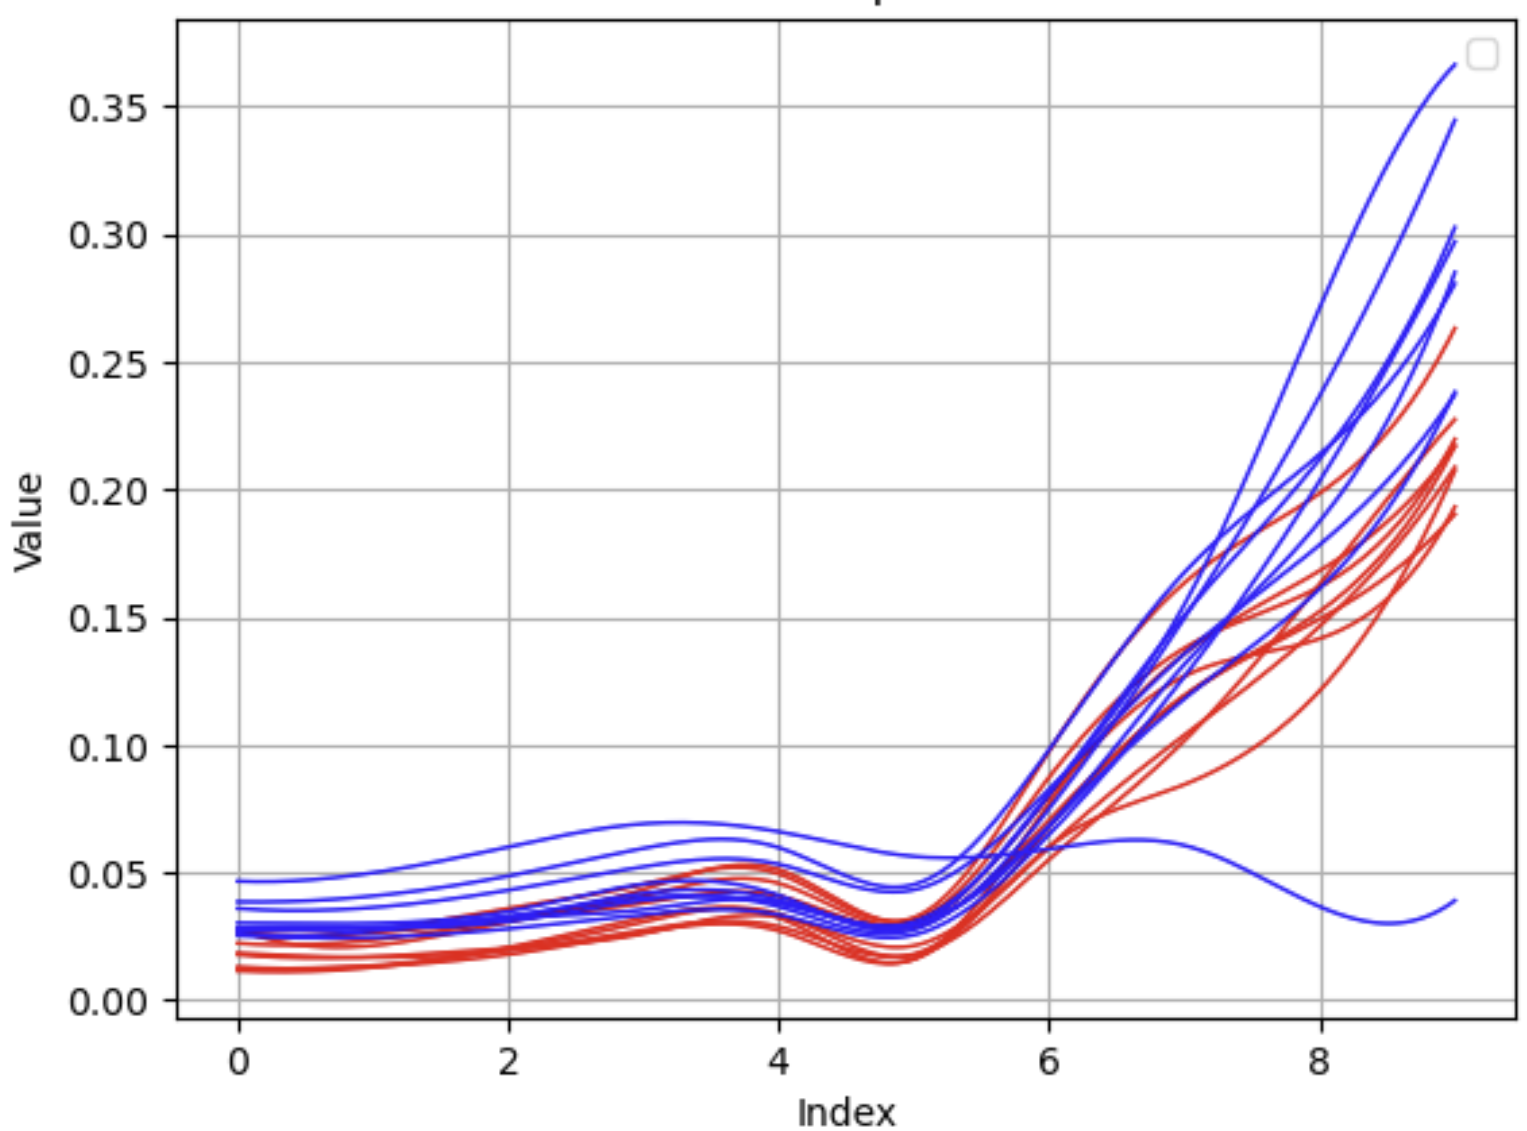
Example of a 10 band signal, smoothed out with a b-spline curve.
But what makes multiband signals so special and useful? That would be it’s ability to see beyond the visible spectrum. Our eyes perceive light in a narrow range of wavelengths, but these signals capture a much broader range, revealing details that would otherwise remain hidden. This is particularly useful when studying things like vegetation or other surface features.
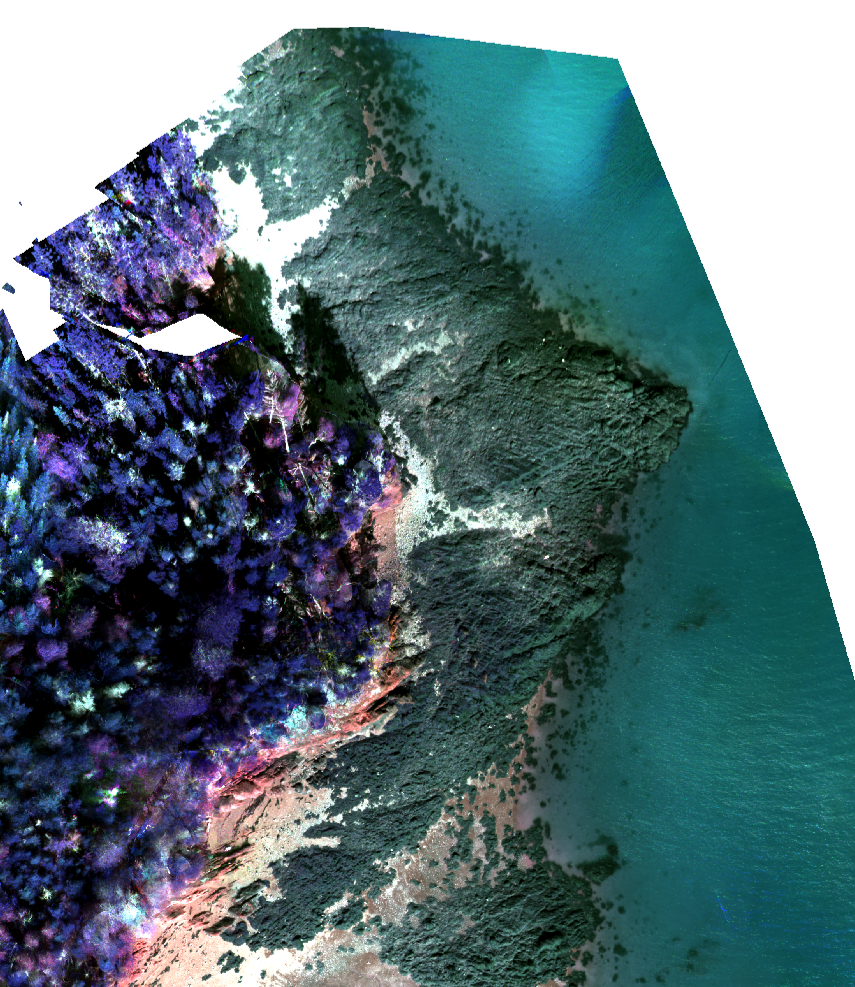
Indices derived from the signal, with proper thresholding, reveals vegetation, sand, boulders, etc. The following is an image using NDVI.
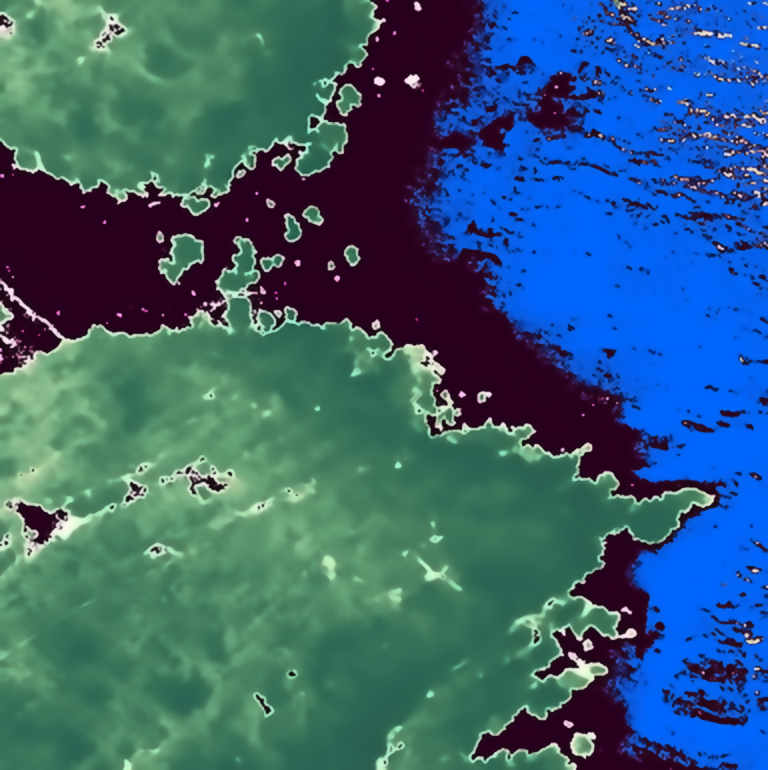
With NDVI, we can see that the green areas are vegetation and blue is water.
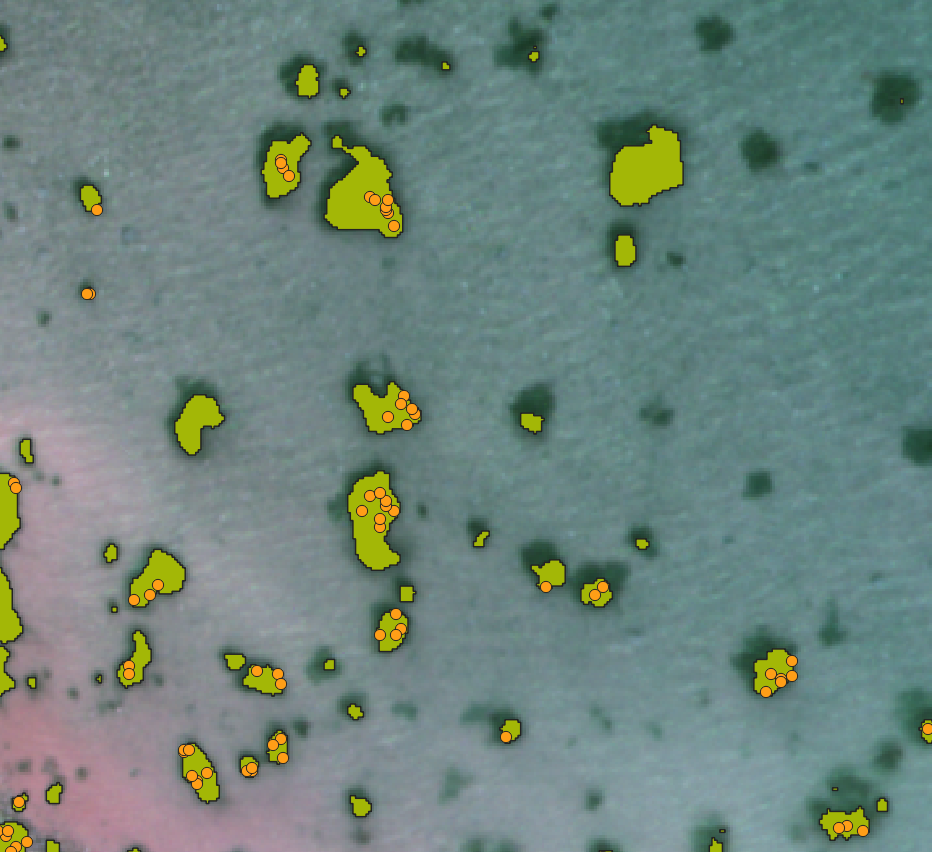
Masking
NDVI and other indices could be used to mask out the vegetation area. By setting a threshold value, we can create a binary mask that separates vegetation areas from other land cover types.
Modeling seaweed
When it comes to predictive modeling vegetation, atmospheric noise is a source of contamination, along with many others. Many correction algorithms exist to help. You could also have multiple species of whatever vegetation you are interested in the same area (6cm blocks for the dataset I work with).
Supervised learning would be ideal with training data (signal and label pairs) that perfectly represents the real-world population we want to make predictions on. This “representative data” would capture the full spectrum of variations and patterns present in the actual data, ensuring that our model generalizes well. Unfortunately, that data is not always available on hand.
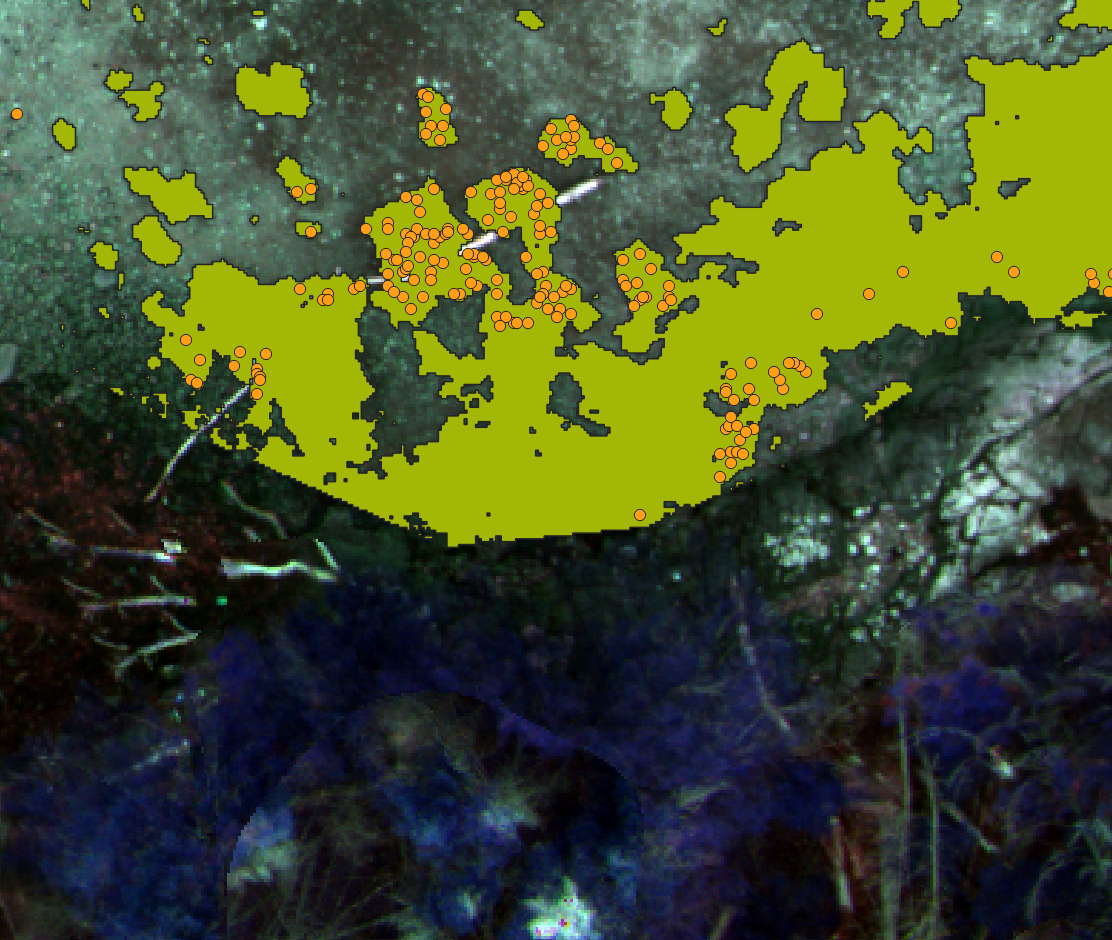
The result below is an attempt to cluster using Gaussing Mixture model. The feature selected are the 10 band, NDVI, NDWI and elevation. From elbo and subject matter experts, the area should have 4 seaweed classes.
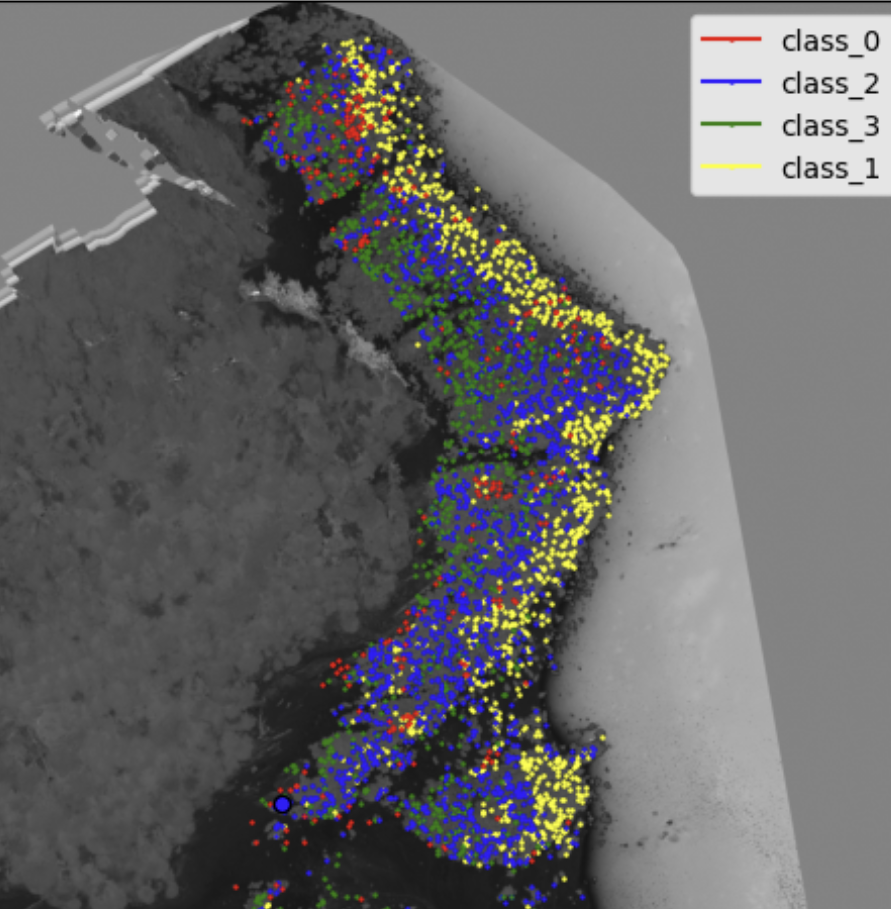
Careful evalation is needed to make sure the above makes sense.
Evaluation
From consulting an expert and inspecting the signals, it turns that clustering was able to tease out the different classes. With some prior information about the area, semi-supervised learning was leveraged. A SVM model was trained:
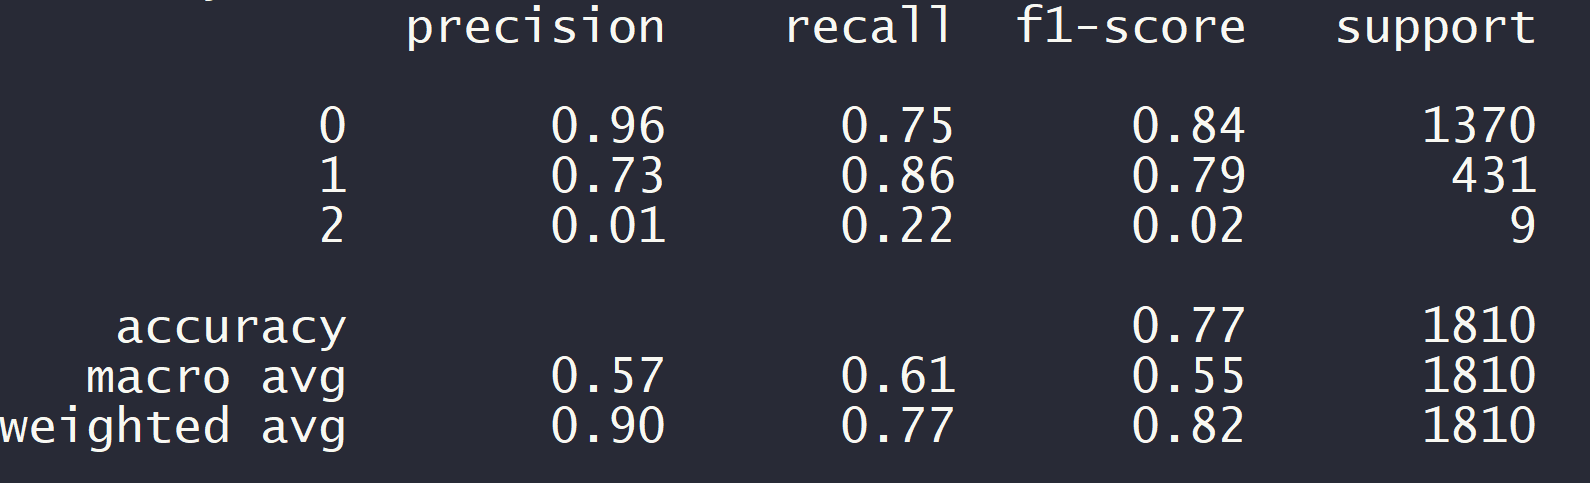
We can see a common problem with multi-class classification with imbalanced data. A common technique to resolve this would be to use SMOTING or some other oversampling technique to balance the classes.