
When a backend service fails to talk to an API, we usually reach for the logs. But logs are not enough at times. They might tell you “Request Failed,” but they rarely show you the exact byte-for-byte payload that was sent, or the hidden HTTP headers that triggered the failure.
Worse, most modern traffic is encrypted (HTTPS). If you try to capture packets with tcpdump or Wireshark, all you’ll see is a garbled stream of TLS handshakes and encrypted binary blobs. You know something was sent, but you can’t see what.
Mitmproxy
Mitmproxy is a specialized “Man-in-the-Middle” proxy that allows you to intercept, inspect, modify, and replay traffic, even secure HTTPS traffic. We’ll set up a Docker lab to inspect the hidden background traffic of an application (we’ll use n8n as our test subject) to see exactly what it’s saying to the outside world.
The Concept: Toss SSL on the Side (On Purpose)
Normally, HTTPS prevents anyone in the middle from reading your data. To debug this, Mitmproxy acts as a “polite hacker”:
- Your application tries to connect to
google.com. - Mitmproxy intercepts the connection.
- Mitmproxy pretends to be Google, dynamically generating a fake SSL certificate.
- Mitmproxy decrypts the request, shows it to you, and then forwards it to the real Google.
This allows us to see the raw JSON, headers, and cookies of encrypted traffic.
The Test Setup
We need three components:
- The Subject: The app we want to debug (n8n).
- The Interceptor: Mitmproxy running in a container.
- The Wiring: Docker networking to force the Subject to talk through the Interceptor.
Here is the docker-compose.yml for our inspection lab:
1
2
3
4
5
6
7
8
9
10
11
12
13
14
15
16
17
18
19
20
21
22
23
24
25
26
version: '3.8'

services:
  mitmproxy:
    image: mitmproxy/mitmproxy:latest
    command: mitmweb --web-host 0.0.0.0 --set web_password=dev
    ports:
      - "8081:8081"
    networks:
      - debug_net

  app_to_debug:
    image: docker.n8n.io/n8nio/n8n
    ports:
      - "5678:5678"
    environment:
      # THE MAGIC WIRING
      - HTTP_PROXY=http://mitmproxy:8080
      - HTTPS_PROXY=http://mitmproxy:8080
      - NODE_TLS_REJECT_UNAUTHORIZED=0
      # ...Other stuff...
    networks:
      - debug_net

networks:
  debug_net:
Profit
Once your containers are up (docker compose up -d), Mitmproxy is running on the remote server, listening on port 8081.
If you are running this on a cloud VPS (like DigitalOcean, Hetzner, or Hostinger), you absolutely should not open port 8081 to the public internet. Exposing your internal traffic inspector to the world is a security nightmare.
Instead, we use an SSH Tunnel. This tricks your local computer into thinking the remote server’s port 8081 is actually on your laptop.
- Establish the Tunnel Run this command from your local terminal (PowerShell or Terminal):
1
ssh -L 8081:localhost:8081 user@your-vps-ip
Leave this terminal window open. As long as it is connected, the secure pipe is active.
- Open the Interface Open your web browser and go to: http://localhost:8081
You will be greeted by the Mitmweb interface. If it asks for a password, type dev (which we configured in the Docker Compose file).
The Split-Screen Debugging Workflow Now comes the fun part. The best way to use this is with a split-screen setup:
Left Screen: Your n8n instance (e.g., https://n8n.yourdomain.com).
Right Screen: The Mitmproxy Dashboard (http://localhost:8081).
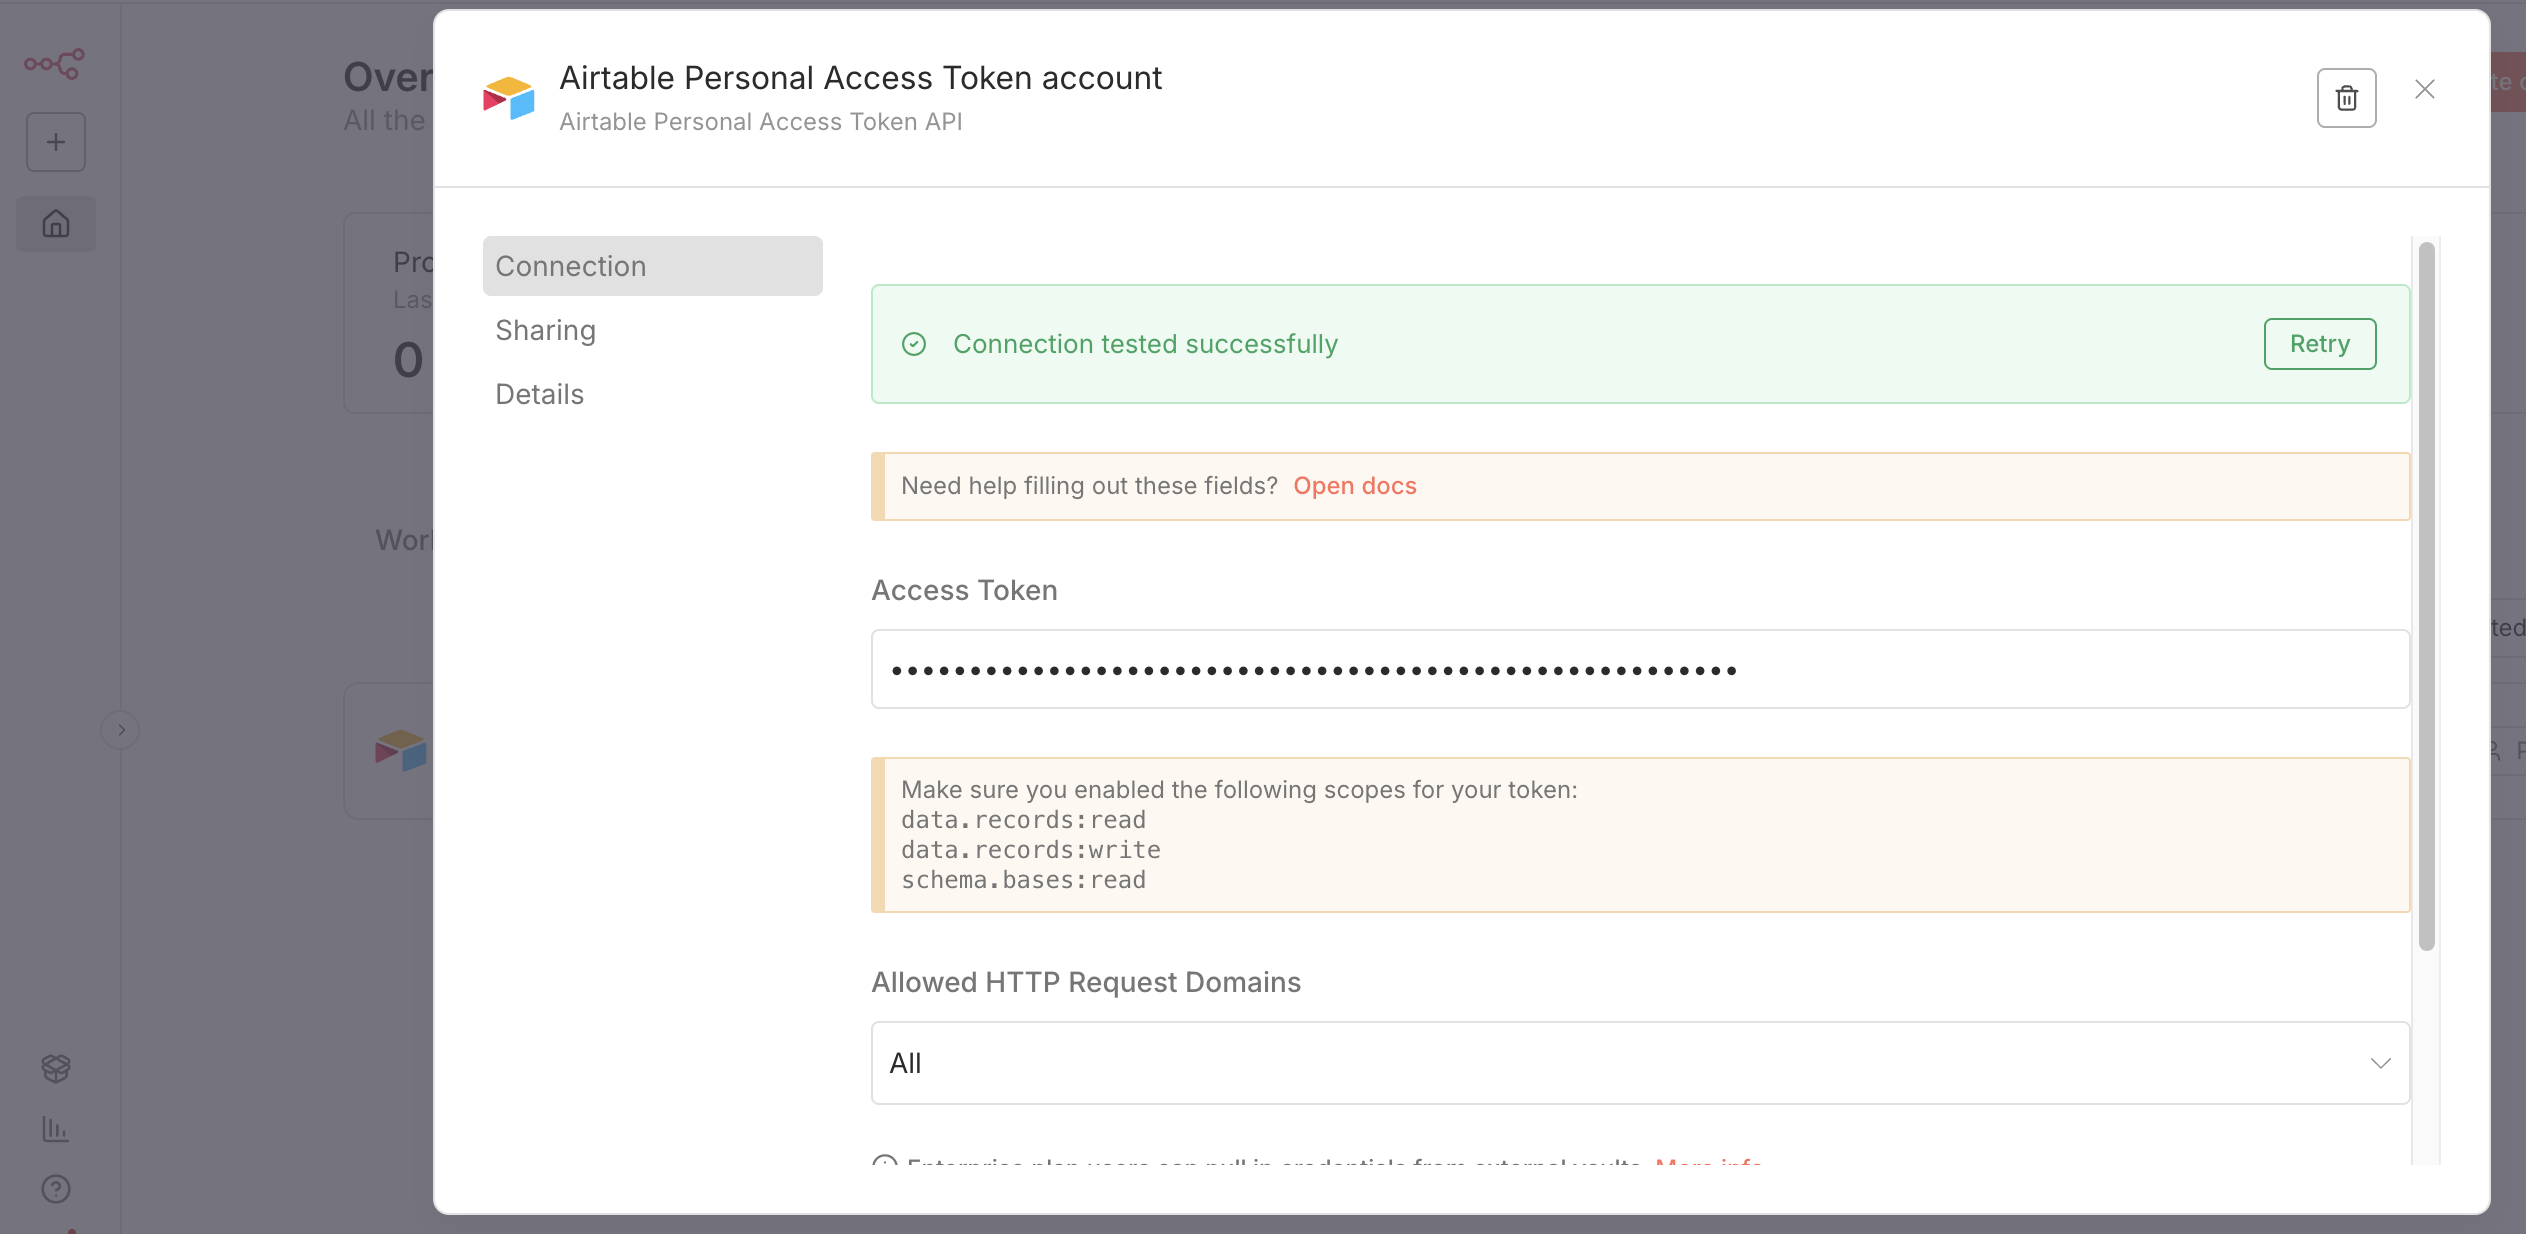
Watching the Magic Go to your n8n dashboard and trigger an action. It could be running a workflow, checking a license key, or connecting a new credential. In the above, you will see mee setting up the credentials for Airtable.
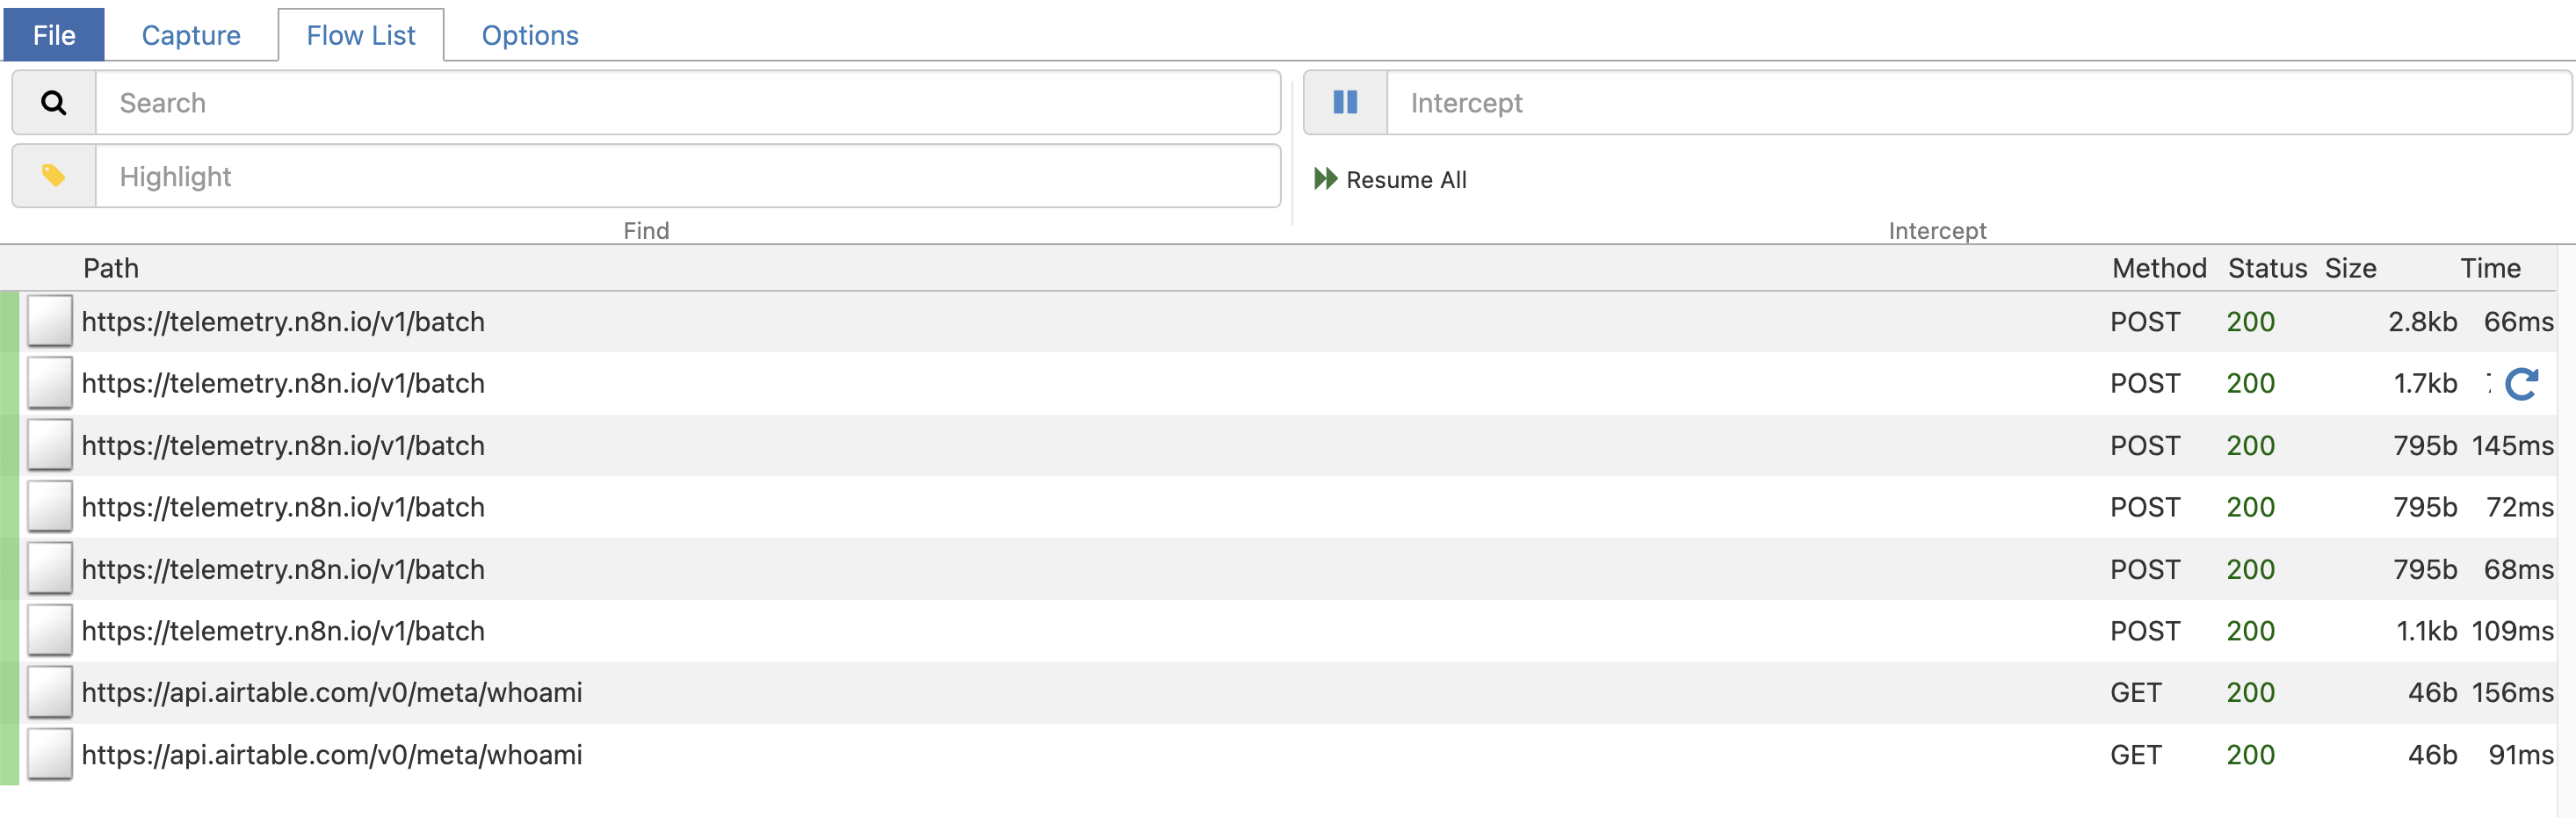
Instantly, you will see the request pop up on the Mitmproxy screen.
The Flow: You’ll see the exact POST or GET request n8n made.
The Payload: Click on the row to open the detail view. You can see the JSON body n8n sent (great for debugging API schema errors)– not shown above.
The Response: Click the Response tab to see exactly what the remote server replied with.
This is often where the “Eureka!” moment happens. You might see a 403 Forbidden because of a missing header, or a 200 OK that actually contains an HTML error page instead of the expected JSON.
Cleaning Up Critical: Once you have finished debugging, do not leave this setup running in production.
Remove the HTTP_PROXY and NODE_TLS_REJECT_UNAUTHORIZED environment variables from your n8n service.
Stop the mitmproxy container.
Restart n8n to restore secure, direct networking.