When developing, we seldom see serious memory thrashing issues. I was fortunate enough to see an issue with an application that was built many years ago. (Note: I was not the developer of the app. I was hired to investigate the issue years after it was deployed.) It was a monolith application based on JBoss Seam. The issue appeared years after it was deployed only because it finally saw the amount of concurrent users and workload that presented it.
The procedure to troubleshoot the issue had to be scientific so that I could convince the stakeholders what steps to take to fix them.
Problem described by users
Users reported that the application was slow or inaccessible at certain times of the day. Slowness needs to be measured, as it can be misleading. The numbers provided were, say, 1 min or more. Normal operation would be 5 seconds or less. The time of the day when the issue appeared was after lunchtime.
Naturally, the suspicion was that after lunch, more users got in to do their work.
Data collection process
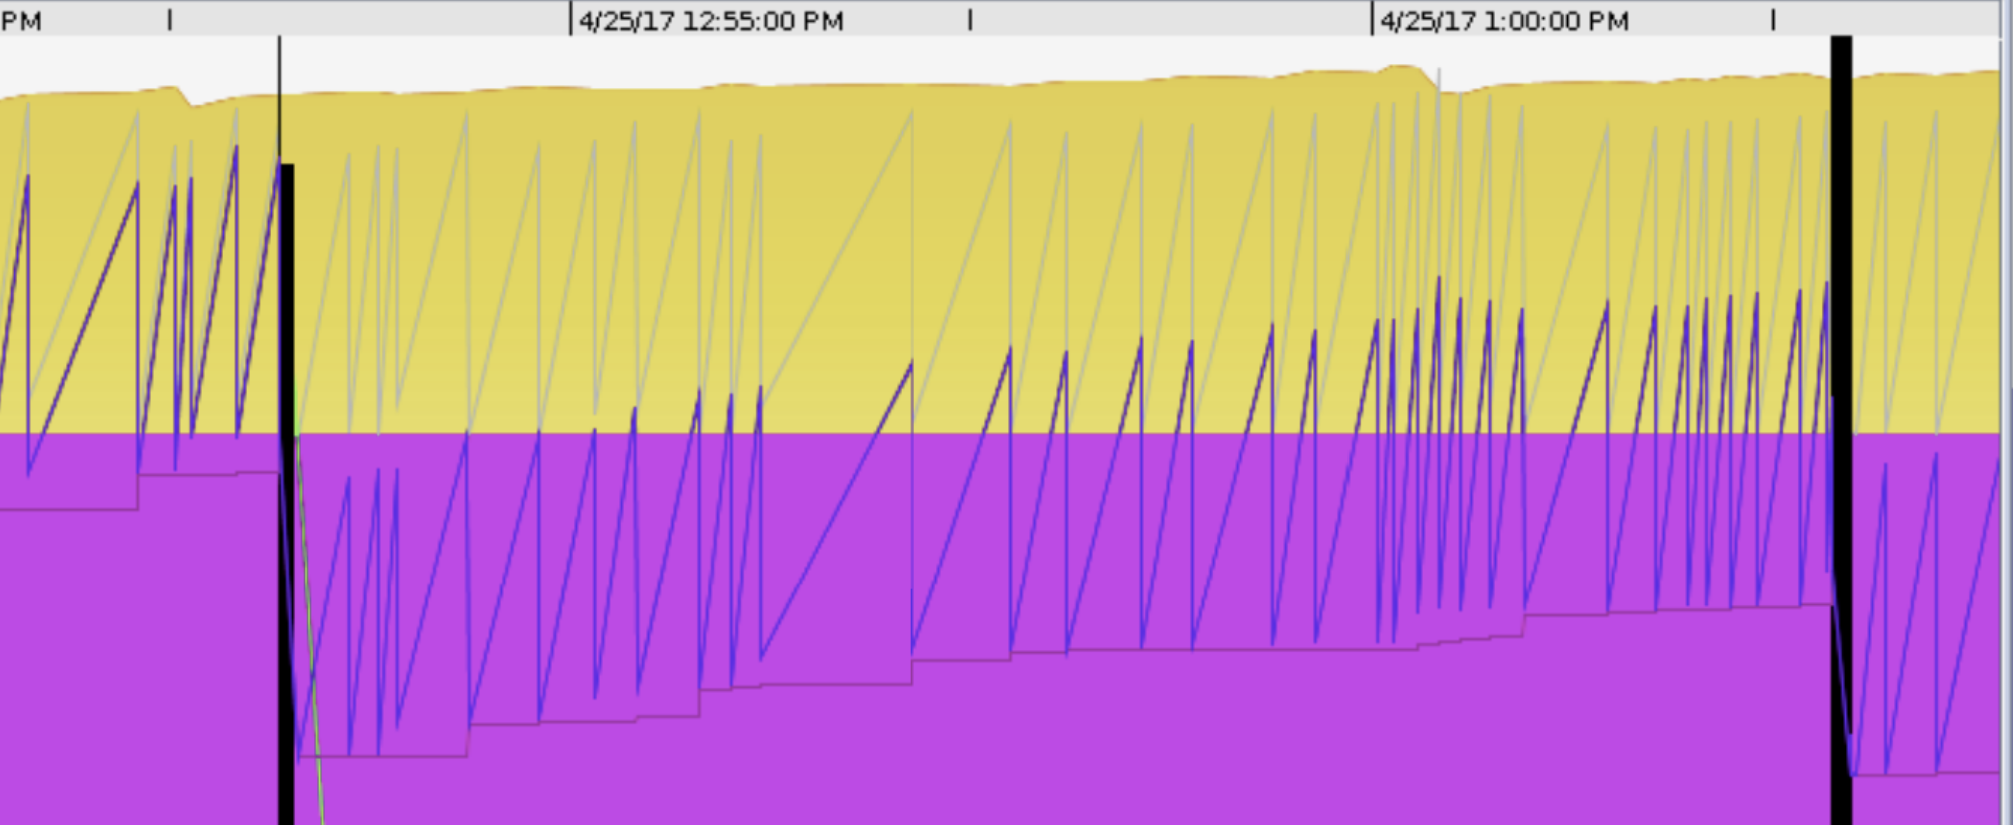
It showed a consistent pattern of the application being inaccessible at certain time intervals, namely after lunch time. For example, we have this memory dump when the issue appeared.
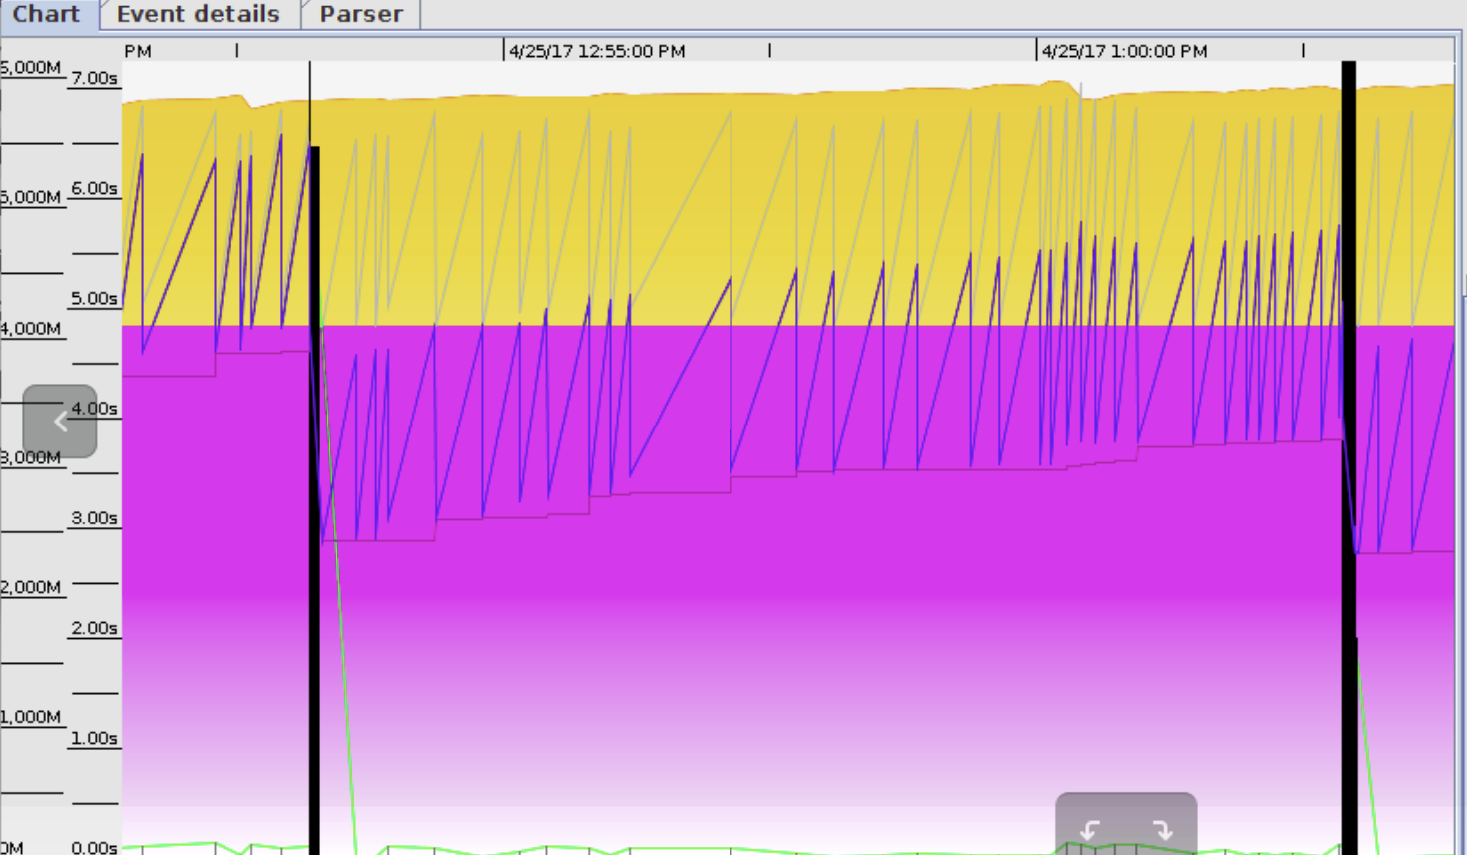
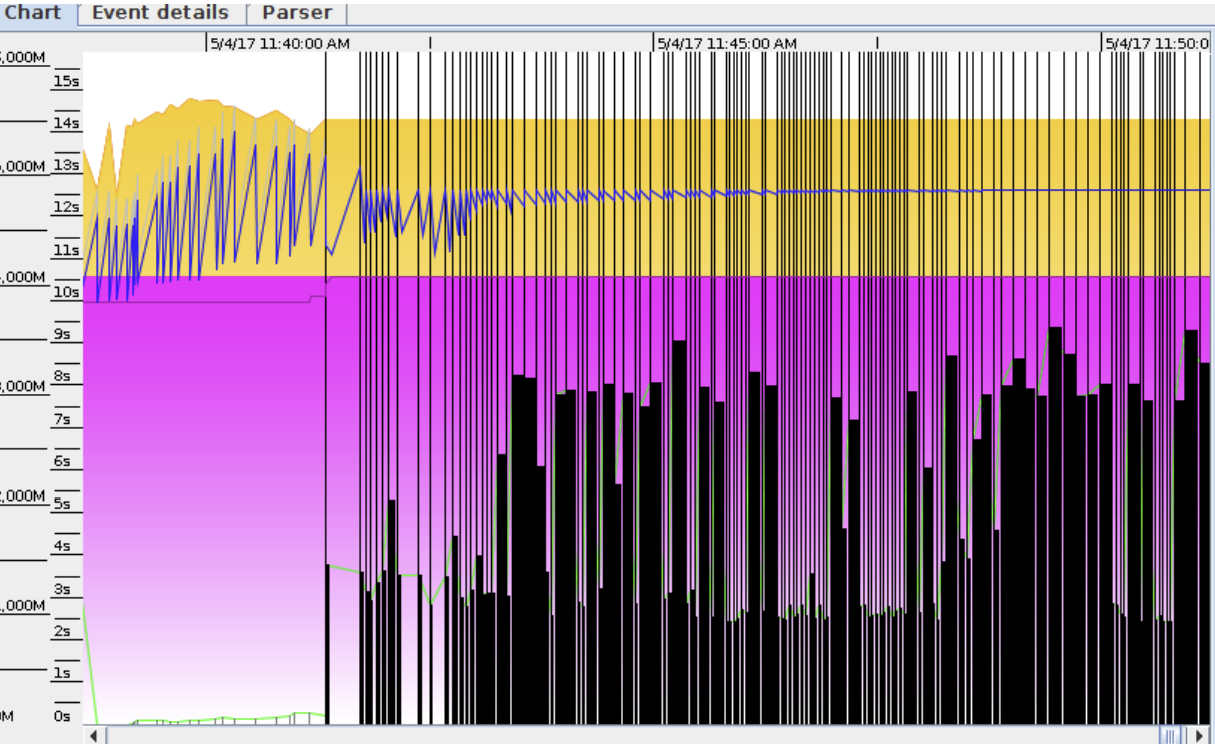
We can see that the app was on a downward spiral here, as full GC’s would not reclaim the memory used. A thread dump was also taken to get an idea on how many concurrent users were on.
(Stay tuned for Part 2)