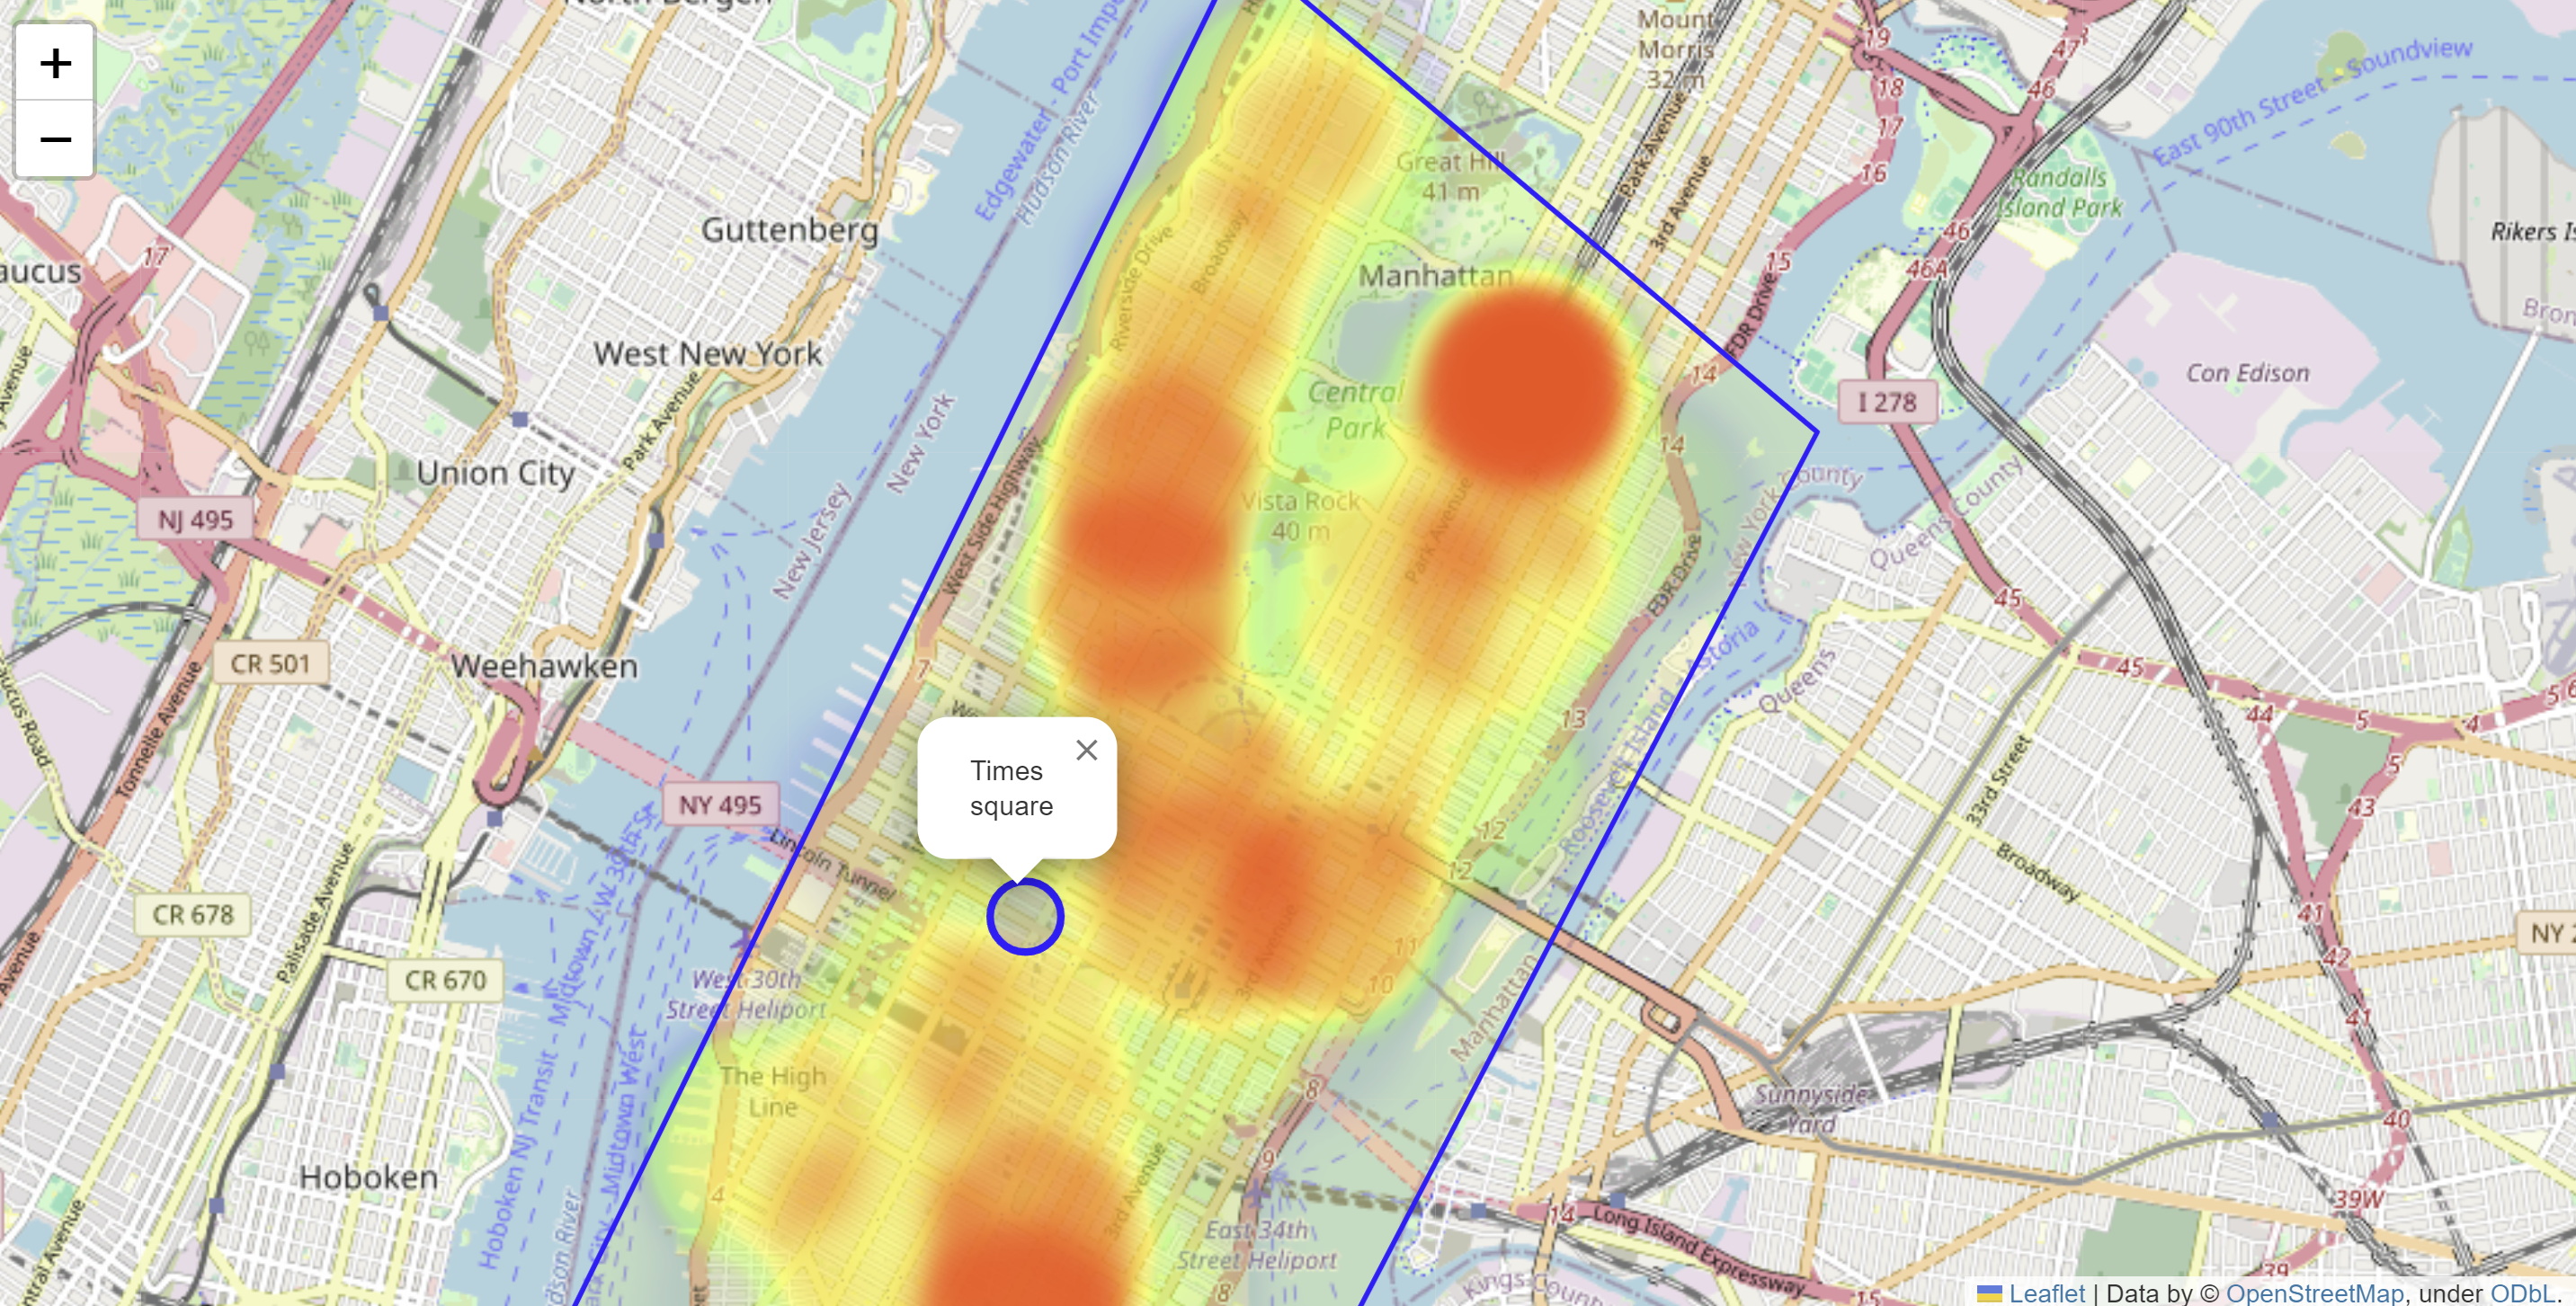
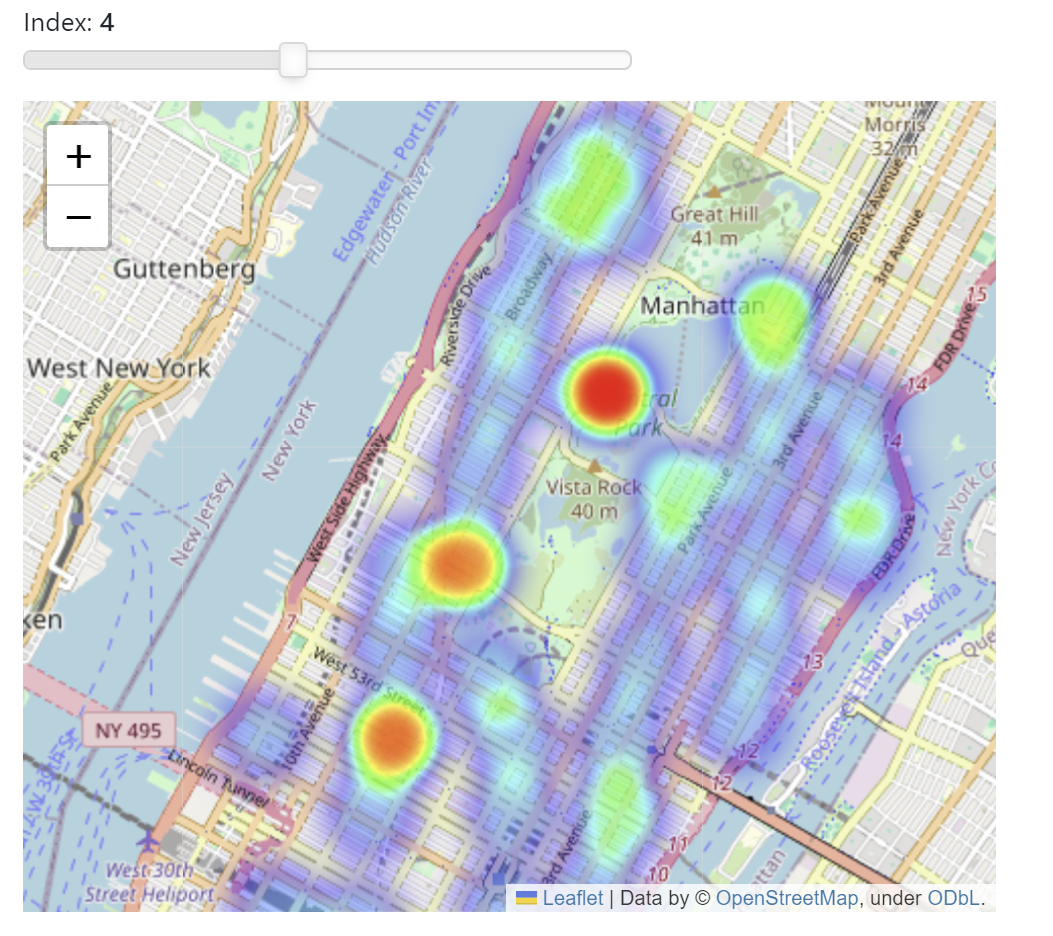
Folium is a useful library for visualization of maps. Here we see a visualization of the distribution of taxi pickups for a certain day at 5pm in Manhattan. I’ve been using Folium for my research work. Stay tuned for more examples in the future…
Basic map:
1
2
3
# Build the default map for a specific location
map_osm = folium.Map(location=[40.7, -74.0], zoom_start=12)
map_osm
We must first center the map:
1
2
3
4
5
6
7
8
9
10
11
12
13
14
15
16
17
18
19
20
21
22
23
24
25
26
top_left = [-73.973205, 40.806470]
bottom_left = [-74.035690, 40.709729]
bottom_right = [-73.992431, 40.696715]
top_right = [-73.934066, 40.781518]

polyNY_shapely = Polygon([(top_left), (bottom_left), (bottom_right), (top_right)])

g1 = wkt.loads(polyNY_shapely.wkt)
g2a = geojson.Feature(geometry=g1)

# Center the map
map_osm = folium.Map(location=[40.7, -74.0], zoom_start=12)

...
# Gather lat/lon data and their weights.
data = list(zip(lat, long, weight))

hm = HeatMap(data,
    gradient={0.1: 'blue', 0.3: 'lime', 0.5: 'yellow', 0.7: 'orange', 1: 'red'},
    min_opacity=0.05,
    max_opacity=0.9,
    max_amount=max(weight),
    use_local_extrema=False)
# Add the heatmap
map_osm.add_child(hm)
We can add a slider with and update the map on a triggered event:
1
2
slider_w = pn.widgets.IntSlider(name="Index", start=0, end=N-1)
pn.Column(slider_w, folium_pane, width=500).servable()


