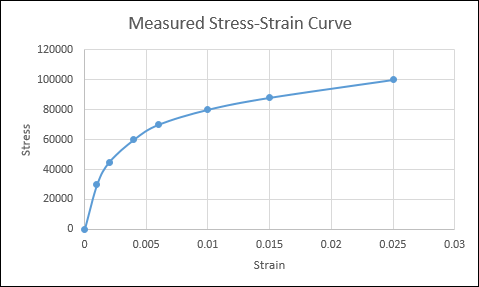
Stress strain data from our experiments are curves. For example,
The upstream data are pickled files. They must be processed and uploaded to s3 for downstream consumption.
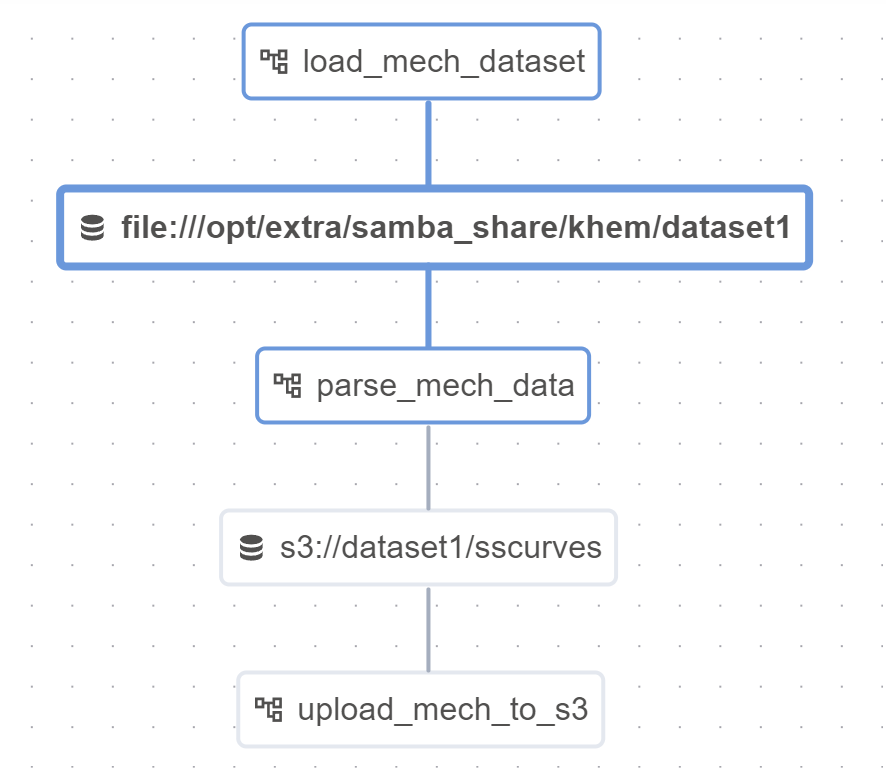
Our Airflow DAGs will use Datasets– they are used for marking data dependencies between workflows. In the below, we will load the curves (pickle files), parse them, and then upload them to s3. For parsing, triggering_dataset_events is provided as well. Notice how the last dag does not have an outlet.
1
2
3
4
5
6
7
8
9
10
11
12
13
14
15
16
17
18
19
20
21
22
23
24
25
26
27
28
29
30
31
32
33
34
35
36
37
38
39
40
41
42
43
44
45
46
47
48
49
50
51
from datetime import datetime, timedelta
from textwrap import dedent
from airflow import DAG
from airflow.datasets import Dataset
from airflow.decorators import dag, task
from airflow.operators.bash import BashOperator
from airflow.operators.python_operator import PythonOperator
from airflow.utils.dates import days_ago

mech_dataset = Dataset("file:///opt/samba_share/dataset1")
downstream_mech_dataset = Dataset("s3://dataset1/sscurves")

with DAG(
    'load_mech_dataset',
    start_date=datetime(2023, 12, 3, 18),
    schedule_interval='@hourly',
    catchup=False
) as dag:
    t1 = PythonOperator(
        task_id='start_python_task',
        python_callable=load_pickles,
        op_kwargs = {"x" : mech_dataset},
        dag=dag,
        outlets=[mech_dataset]
    )

with DAG(dag_id="parse_mech_data", start_date=datetime(2023,12,3,18), schedule=[mech_dataset], tags=["consumes", "dataset-scheduled"], catchup=False) as dag2:
    t2 = PythonOperator(
        task_id='query_python_task',
        python_callable=parse_data,
        op_kwargs = {"interval_start" : "{{ (triggering_dataset_events.values() | first | first).source_dag_run.data_interval_start}}"},
        dag=dag,
        outlets=[mech_dataset]
    )

with DAG(dag_id="upload_mech_to_s3", start_date=datetime(2023,12,3,18), schedule=[downstream_mech_dataset], tags=["consumes", "s3"], catchup=False) as dag3:
    t3 = PythonOperator(
        task_id='upload_mech_to_s3_python',
        python_callable=upload_to_s3,
        op_kwargs = {
            "downstream" : downstream_mech_dataset,
            "upstream" : mech_dataset,
        },
        dag=dag3
    )

...
# Add dag for training

# Add dag for deploying models
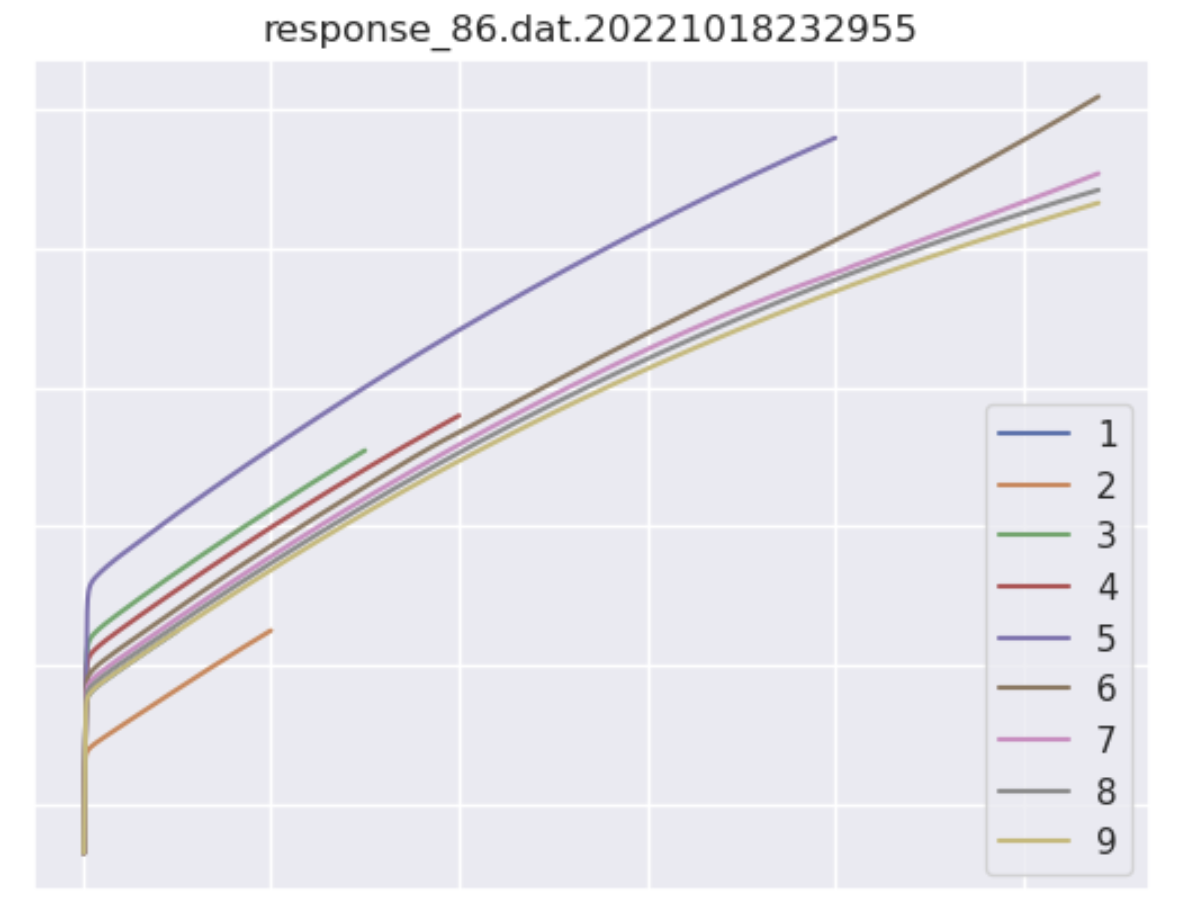
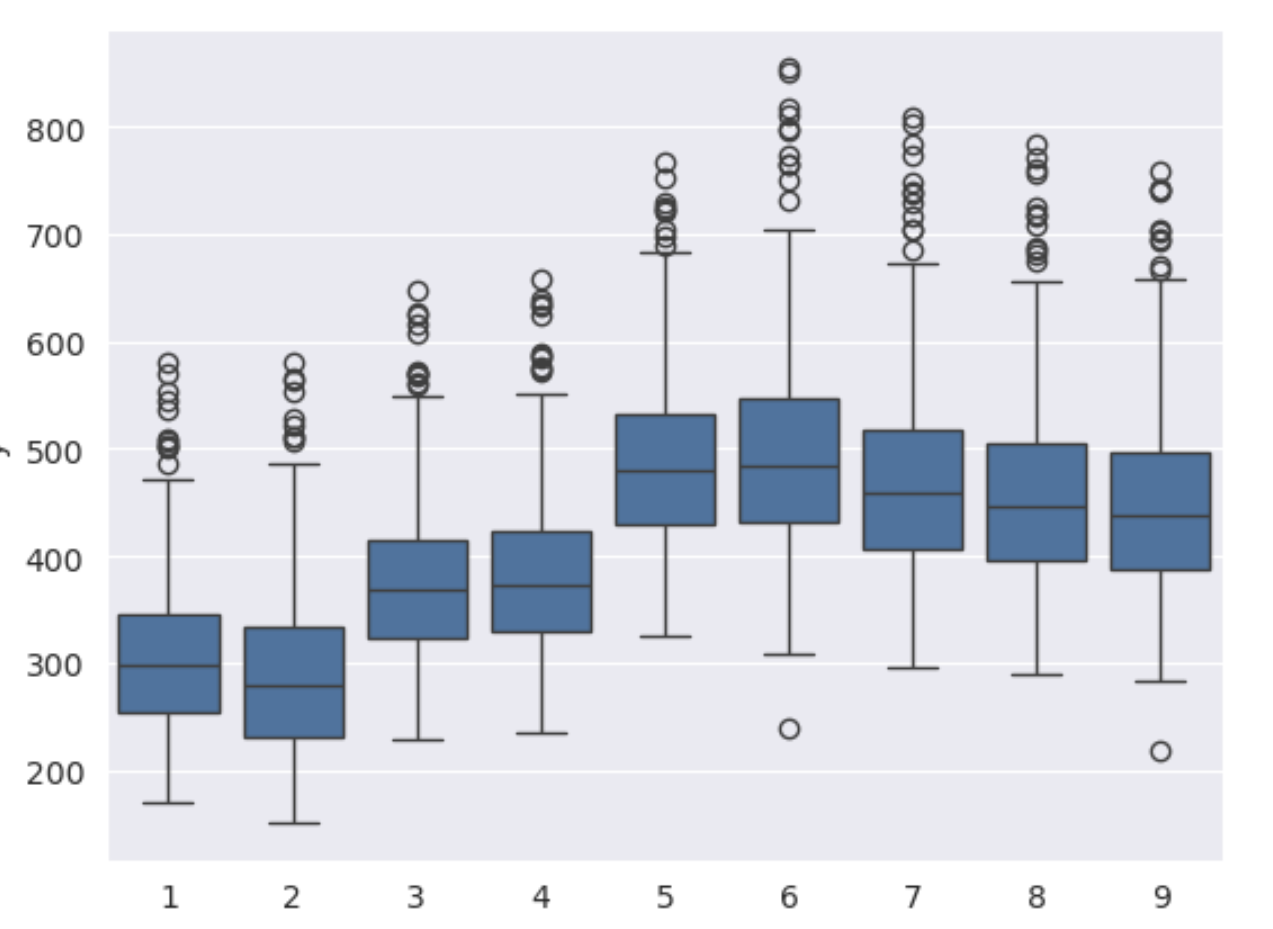
A useful task would be to plot some of the new data and various statistics to see how the data may have drifted. These are made available to users via a dashboard:
We can see the dependencies here: